Quick Answer
Google PageSpeed Insights is the gold standard when it comes to checking website loading time. But that’s primarily designed for developers. Non-techies can look at Pingdom and GiftOfSpeed instead. Other popular tools include GTmetrix, WebPageTest, and YellowLab Tools.
No one can afford to fall behind in this fast-moving world, not even websites. While you may overlook website loading speeds, thinking a few milliseconds extra won’t break the planet apart, you would be wrong. Reports suggest that nearly 83% of users expect a website to load faster than a breathing cycle, under 3 seconds, to be precise. Worse, 40% of the users won’t give a damn if a website takes more than 3 seconds to load.

Even more concerning statistics spotlight the demerits of a slow website regarding customer retention. Low SEO ranking, poor customer experience, and increased bounce rate further worsen the problem. However, the silver lining is that you can work on fixing your website if it’s tested slow. Testing website loading speed is child’s play, thanks to free tools available on the internet. This article lists ten tools to check website loading speed, all for free.
Slow websites are great at highlighting backend and frontend problems that may have been left unsolved. You can quickly know if your website has too many adverts or design elements slowing it down or needs further refinement on the developer’s end. It’s a great metric to see how your website compares to your competitors. Users can run website speed tests to check if their internet connection is causing the problem or if the host website is facing issues on their end.
Table of Contents
Google PageSpeed Insights
Many developers use Google PageSpeed Insights, a widespread tool, to check their website’s loading speed. PageSpeed Insights displays the results as scores out of 100, which is effortless to understand and act upon. Being Google’s offering, you get to enjoy valuable perks such as diagnosis and assessment scores for both desktop and mobile, all for free.

The first step in the process is the Core Web Vitals Assessment, which puts time to first byte (ITFB), cumulative layout shift (CLS), first input delay (FID), and more to test before proceeding with further assessments. After this, the entered website undergoes the Lighthouse scoring assessment that tests varying parameters and produces a score out of 100, with separate scores for SEO, performance, accessibility, and best practices. A score over 90 is considered good.
When it comes to diagnosis, Google doesn’t back out. You can view your website’s probable shortcomings alongside potential memory and time savings if you resolve them. Google PageSpeed Insights mentions the problem-causing elements in detail, both for desktop and mobile operating systems. As an official yet free tool that’s best for testing the core web vitals (CWB), you can’t ask for more, nor does it disappoint in any way.
Pingdom
If you want to perform an even more practical test on your website, look no further than Pingdom. As popular as it is, Pingdom is known for its detailed test results, which are quite beneficial. With popular server locations to choose from, you can run the test from the United States, Europe, or even Japan. You are given a score of 100, a performance grade, the website’s load time, size, and page requests.

It doesn’t end here: Pingdom also suggests measures to improve your results, such as changing the position of JavaScripts, reducing HTTP requests and URL redirects, and much more. It also includes a handy short description of each issue. Furthermore, Pingdom showcases the requests and sizes taken up by each content type and domain with every report.
While the free version should suffice most, the Pro version has a few cool features. The Pro version of synthetic monitoring adds performance monitoring, uptime monitoring, e-mail and SMS alerts, and more to existing features. The Pro version of real user monitoring is worth checking out, as it includes monitoring the site from a user’s perspective, making it more practical and accurate.
GTmetrix
GTmetrix is one of the best tools for checking website loading speed, thanks to its unmatched performance reports. By default, GTmetrix runs the test from its Vancouver server in Canada via Chrome browser, but this can be altered if you log in. The report includes an overall test grade and cumulative percentage scores of website performance, structure, largest contentful paint (LCP), and more.

The best part of GTmetric reports is the nifty timeline section, which precisely mentions the time taken by each element to load, neatly presented in a visual timeline. Furthermore, the test report includes supremely detailed reports of the website’s performance, structure, and waterfall chart. Alongside mentioning the time the website takes to load various elements, you also get a list of top issues and how you can rightfully solve them.
While GTmetrix’s free plan is already quite generous, you can upgrade to its Pro membership if you are intrigued by mobile device testing, additional test servers, periodic monitoring, more on-demand tests, and simultaneous monitoring of extra websites. Regardless, GTmetrix is worth checking out to view and improve your website loading speed.
WebPageTest
WebPageTest is well-known for its true-to-life testing parameters, which are not offered by many websites. Unlike most others, which test run the website once and call it a day, WebPageTest tests the website three times to produce accurate results. All that, along with free yet detailed reports for each run, is why we think WebPageTest is worthy of being among the best tools to check website loading speed.
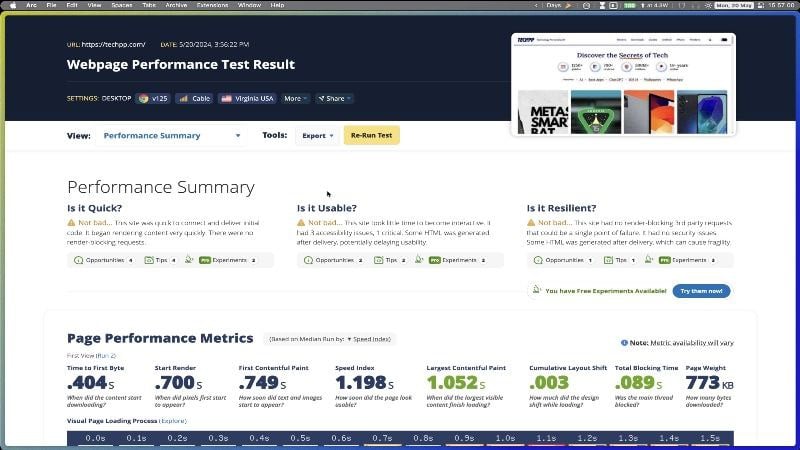
WebPageTest mixes and matches the network parameters, such as discrete server locations (United States, Canada, Germany, and India), different browsers (Chrome, Microsoft Edge, and Mozilla Firefox), devices (mobile or desktop), and internet form (mobile data, ethernet, and Wi-Fi). There’s even an advanced configurator that lets you fully customize the testing parameters. You can also run specific tests, such as the Lighthouse speed test, core web vitals test, and, interestingly, a carbon footprint test, too!
The report doesn’t include a grade or score but valuable suggestions and the test summary. Alongside the page performance metrics neatly presented in a timely, WebPageTest also displays the real-world usage metrics that mention the time taken for first contentful paint (FCP), cumulative layout shift (CLS), time taken to first byte (TTFB), and more to load. It also gives experimental suggestions that can benefit your website’s performance. While the pro version is mainly suited for group users, the free version is excellent already.
Yellow Lab Tools
If you are looking for a no-nonsense tool to test website loading speed, Yellow Lab Tools is for you. The best part is that it’s free and open-source, a rare sight, to say the least. Setting the testing parameters is easy: choose the device type—mobile, desktop, or tablet—and configure the advanced settings if needed. We have to mention the site’s responsiveness, which is commendable.
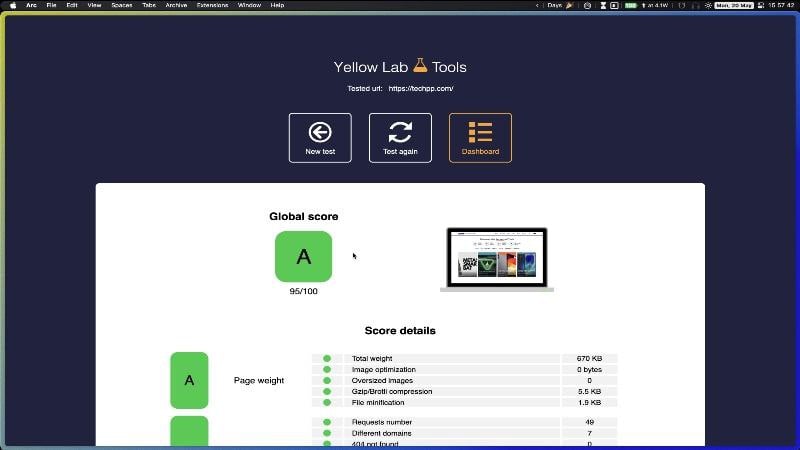
The test outputs aren’t fancy but fully functional. You get a graded sheet, somewhat like the school assessment reports, with individual grades for parameters like page weight, DOM complexity, JavaScript complexity, web fonts, server configurations, and more. The grades are accompanied by comprehensive scores for their respective elements, as well as necessary details such as load time, memory taken, and more.
An immediate shortcoming of Yellow Lab Tools’ speed test is the lack of diagnosis reports and suggestions to improve the website’s performance. Therefore, you will have to rely on your skills in this regard. However, as mentioned on the website, you can approach the developer for tips and suggestions. As a free tool that’s also open-source, Yellow Lab Tools is a great contender, especially if you can work on the test results yourself.
GiftOfSpeed
GiftOfSpeed is a simple yet functional tool for testing website loading speed. While other tools charge for running more tests, continuous monitoring, and other services, GiftOfSpeed is free throughout, except for expert guidance to improve your site’s performance, for which you must lodge a separate request. Unlike the previous option, GiftOfSpeed also includes suggestions to improve the site’s performance.

GiftOfSpeed can run the test from servers in the United States, India, the United Kingdom, or the Netherlands. You can also set your preferred testing device, either desktop or mobile. GiftOfSpeed shows the overall score as a percentage, with key speed metrics for various elements, including cumulative layout shift (CLS), largest contentful paint (LCP), total blocking time, and many more. The data is pleasantly presented.
You also see a visual loading progression, but there is no mention of the time it takes for elements to load fully. The report also mentions the size taken up by various elements, such as JavaScript, HTML, images, and fonts. Issues are presented in a separate section, including a small yet helpful description. There’s also a waterfall view if you prefer that. Overall, GiftOfSpeed is an excellent tool for running occasional tests.
DebugBear
If performance reports are all you care about, say hello to DebugBear. There’s just one testing server – the United States- and you can conduct the test from a desktop or mobile server. After that, a report gets generated in a corporate-looking UI, which is very detailed in every way. DebugBear doesn’t shy away from showing the results, as every imaginable thing is mentioned in the report.
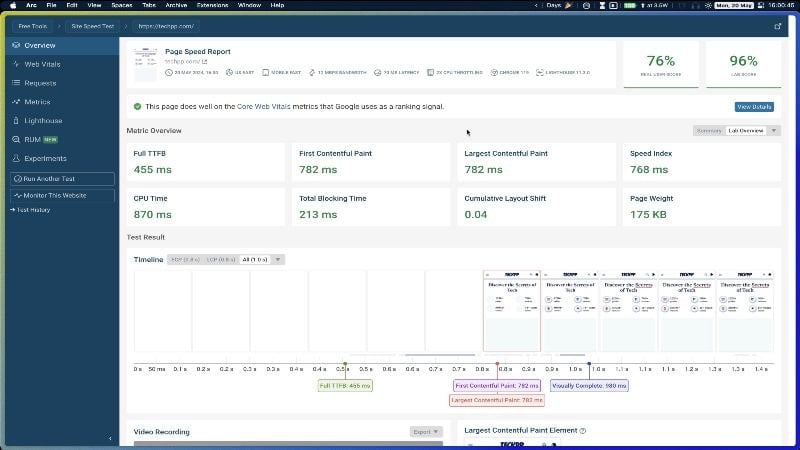
The result overview includes time taken by essential elements, like first contentful paint (FCP), time taken by first byte (TTFB), speed index, total blocking time, and more. Additionally, there’s also a result timeline and a video recording of the test, something which isn’t accessible in most tools. The result overview also has a long list of recommendations for improving the page results.
It’s not over yet, as even more detailed reports are available for web vitals, lighthouse speed test, and page requests. If you subscribe to the pro version, you get even more performance data, which is best suited for businesses and enterprises. The paid version also includes real user monitoring, synthetic website monitoring, and more. DebugBear is the best tool for professionals to test website loading speed.
Lighthouse Chrome Extension
Lighthouse is an open-source tool from Google that helps developers assess their website’s performance. In fact, many sites use Lighthouse assessment as a testing parameter. This isn’t a website but a browser extension that enables you to run the assessment instantly without leaving the website. The Lighthouse Chrome extension is perfect if you need to check a site’s performance quickly, as it doesn’t get faster than this.

The extension is as simple as it gets. Before running the test, you only need to set two things: the device type and where you want to see the result. The performance report opens via Google PageSpeed Insights, which is unsurprising, considering both are Google’s solutions. You get precisely the same output as with Google PageSpeed Insights but with added convenience.
Uptrends Website Speed Test
Uptrends is the top dog among all tools mentioned in this list, thanks to its reliability and detailed performance reports. Not to forget its immense popularity over the years, and the fact that it’s free makes it an even better offering. Even in its free version, Uptrends has a truckload of free servers to run the test, including the United States, the Netherlands, South Korea, France, Hong Kong, and plenty more. You can also set your preferred screen resolution, browser type, and bandwidth throttling, something that not many sites offer.
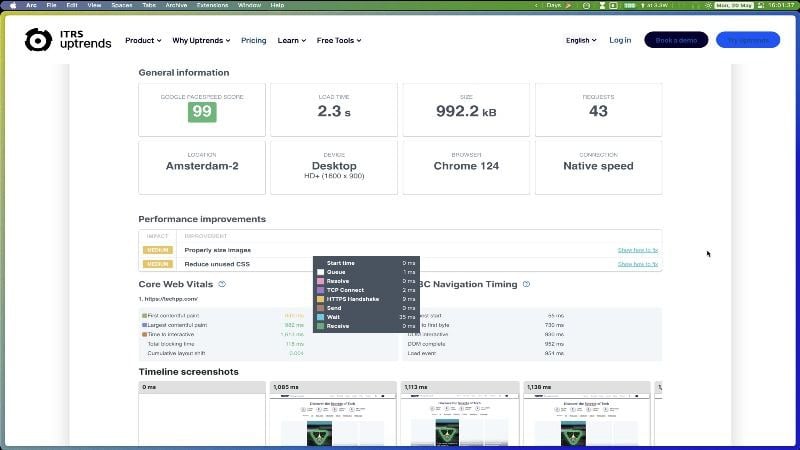
First and foremost, the data is beautifully presented. The initial part of the report consists of the usuals, like load time and page size, accompanied by the time taken by core web vital elements. There’s also a timeline view, waterfall output, and a pie chart view. Over and above website-specific suggestions, Uptrends also includes general tips to elevate performance numbers further.
While Uptrends doesn’t include many suggestions for improvement, it’s an excellent tool regardless. Though the free version might be enough, you can consider upgrading to the premium version if you are a business looking for automatic tests, continuous monitoring, real-time user data, more test servers, and more.
Dotcom Speed Test
The Dotcom speed test tool is somewhat similar to Uptrends, which is a compliment. Following the similarities, Dotcom offers a healthy number of test servers, plus different browsers (Google Chrome and Microsoft Edge), device types (Desktop, Android, or iPhone), screen sizes, and the option to set network throttling.

The report overview doesn’t include much: the time it takes for the full page to load, the first meaningful paint, page size, and a few other things. The detailed report presents the results using a waterfall view, which makes it easy to understand and study. The report can be configured to show the time and size taken by various elements present on the website.
Unfortunately, the Dotcom Speed Test doesn’t mention the issues and how they can be resolved, which is a bummer. Nevertheless, the Dotcom Speed Test tool is a decent offering if you know how to fix things yourself. There’s also a paid tier that unlocks additional test servers, automatic test runs, test data retention, and more.
Improve Website Loading Speed Using These Tools
That’s all, folks! The ten tools mentioned above are among the tools developers prefer to test and improve their sites. More importantly, the tools are free to use and produce detailed performance reports, which is quintessential for a developer to study and act upon.
