Quick Answer
Chrome DevTools isn’t just for developers. It includes several practical features regular users can benefit from, such as capturing full-page screenshots with device frames, recording step-by-step website actions, blocking heavy scripts to speed up slow sites, stopping redirects and pop-ups, editing webpage elements, running automation scripts, checking what data sites store, and keeping hover menus visible.
Most people think Google Chrome DevTools are only designed for web developers, but there are plenty of hidden features that can be very useful for regular users, too.
For example, using the built-in screenshot tool, you can add a device frame to make screenshots look more professional, capture high-quality full-page screenshots in a single click, and use the browser console to run scripts to automate time-consuming browser tasks.
For the past couple of days, I have been testing Google Chrome DevTools.
After testing, here are the eight best use cases I found that can be useful for everyone, not just for developers. Whether you are a power user, a content creator, a social media manager, or are looking to find the hidden Chrome tricks.
If you are a beginner, you might find DevTools technical at first, with code, scripts, technical terms, and more. However, trust me, they are easier to use once you get familiar with them.
Most DevTools that we are going to discuss in this guide, like screenshots, element inspection, and running snippets, don’t require any prior coding knowledge, and the best part is that even if you make any changes, you can reset things to default just by refreshing the webpage. So, with that in mind, let’s get started.
Table of Contents
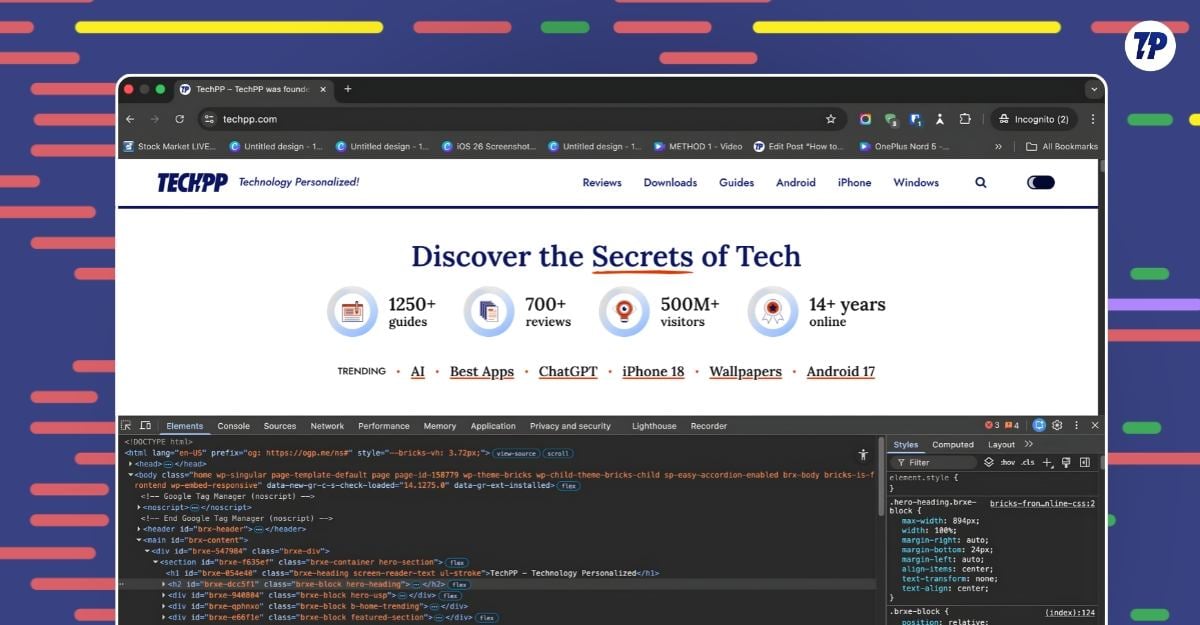
Understand the Chrome DevTools Interface First
As I said earlier, Google Chrome DevTools can be confusing and technical for beginners.
To make it easy for you, here is a simple demonstration that can help you understand the Chrome DevTools interface first.
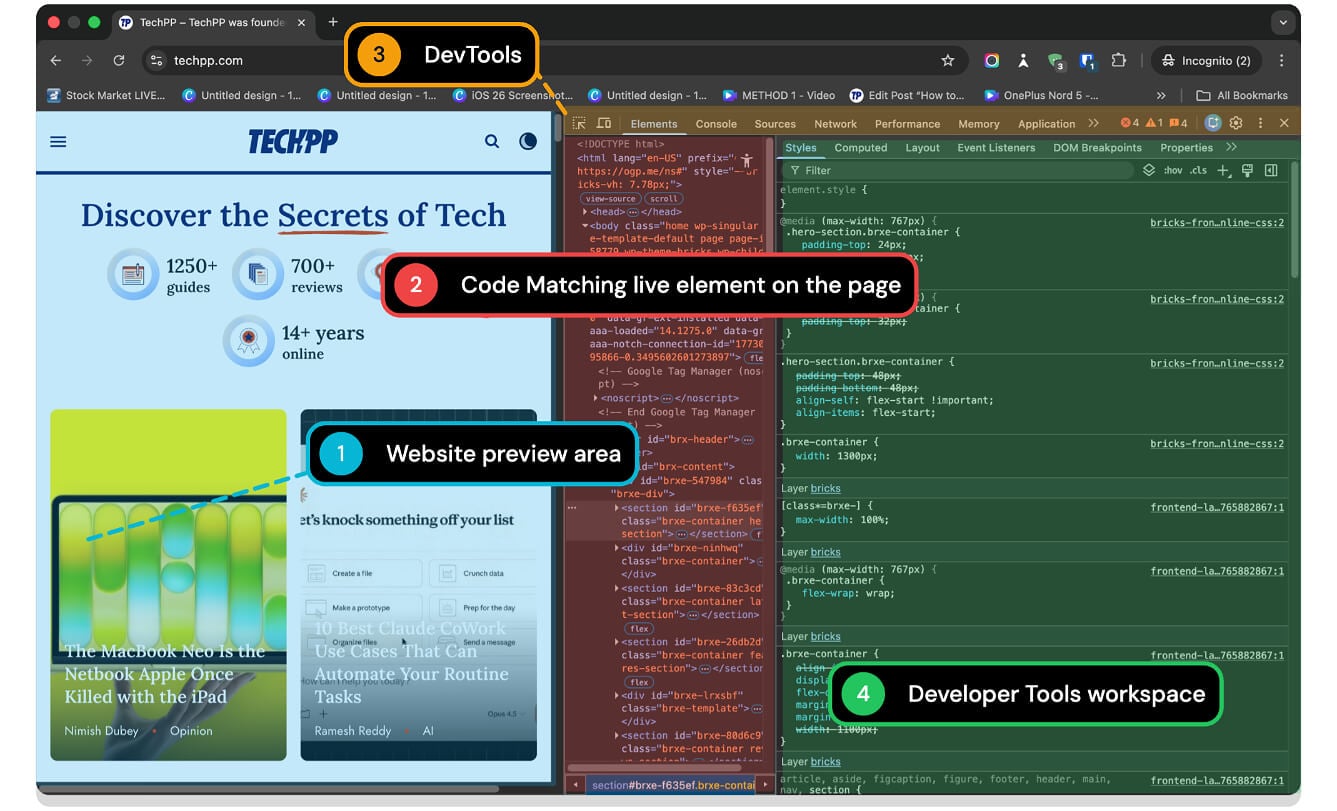
To open Google Chrome DevTools, you can use shortcuts or right-click on any webpage and tap on Inspect.
- On Mac, you can use: Cmd + Option + I
- On Windows: F12 or Ctrl + Shift + I
Take Better Screenshots and Add Device Frames
Google Chrome DevTools comes with a built-in screenshot tool that lets you capture screenshots of any webpage.
It is primarily designed for developers to test their websites on various platforms. However, anyone can use it to take screenshots of any website without relying on system or third-party extensions.
It supports various modes. You can capture a specific part of the website, even if it’s not visible on the screen, or capture the entire website with a single click.
Plus, it also comes with a device mode which lets you view the website on different screens, including mobile, tablets, and even on Nest Hubs. You can also add frames to make your screenshots look more professional.
The only downside is that this screenshot tool is hidden inside the DevTools and requires you to navigate a complex workflow. Also, unlike other tools, you won’t be able to add annotations or copy the screenshots directly without saving them locally onto your device.
However, it is still great for high-quality full-page screenshots and styling them with a device frame.
Here is how to take screenshots in Chrome DevTools:
Step 1: Open any web page you want to take a screenshot of and open DevTools. You can use the shortcut or right-click on the web page and tap on “Inspect” to bring up DevTools.

Step 2: Tap on the Device Toolbar.

Step 3: Now tap on Select any device to view the website on different devices.

Step 4: To take a screenshot, tap on the three-dot menu in the top right corner and tap on “Capture screenshot.”
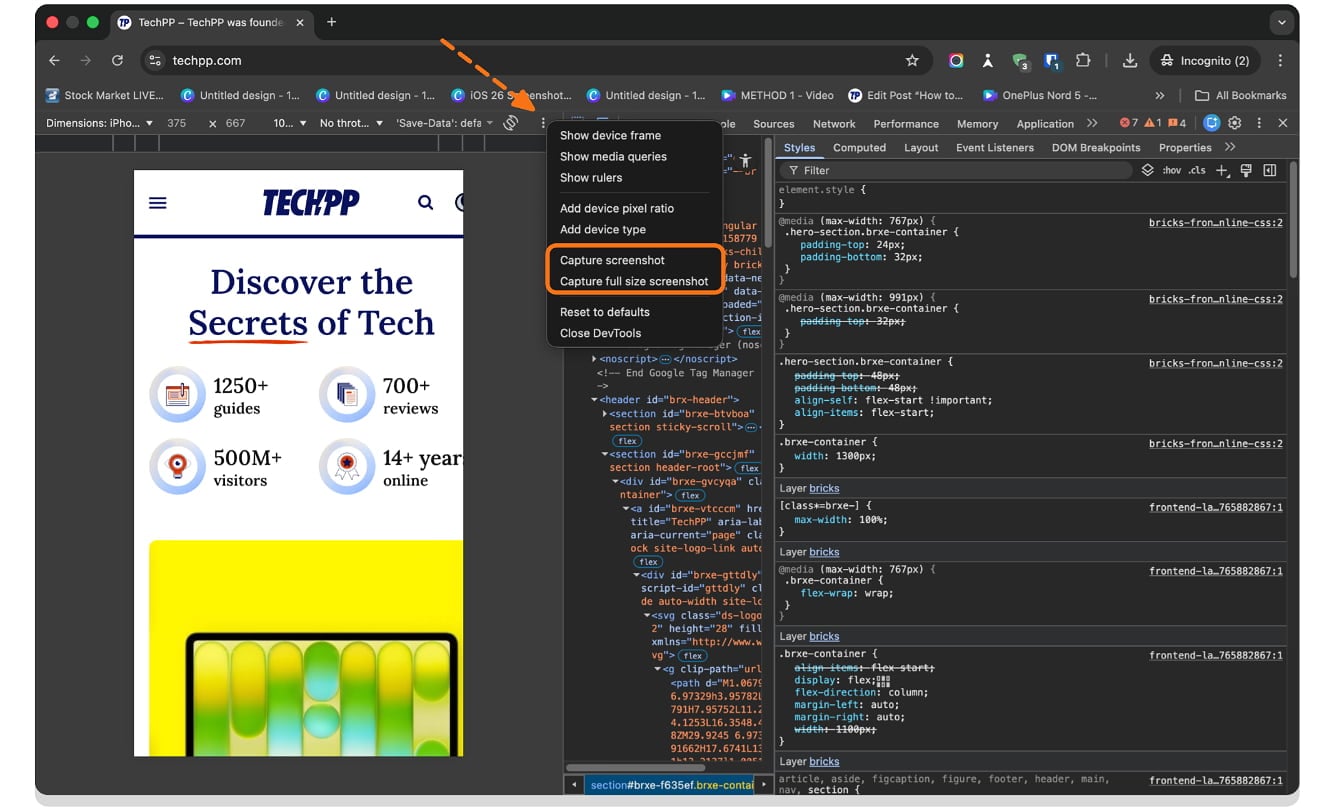
Step 5: Now, to add the device frame, click on the three-dot menu again and tap on “Show Device Frame.” Now, select the devices you want to add a frame.

Record Website Steps and Share Them Easily
Beyond screenshots, Google Chrome DevTools also comes with a built-in recorder that lets you record all the actions you perform on a website.
This is especially useful if you want to demonstrate a complex process on web pages and share it with someone to test it. This method is sometimes better than sharing screen recordings.
For instance, unlike screen recording tools, where you need to record your entire screen, edit it, and share it as a video, using the DevTools recorder in Google Chrome keeps track of every step on your webpage with exact actions like clicks, typing, and more, and shows them in a structured format.
Once you have recorded your actions, it automatically creates a flow; you can replay, edit, and add new steps in between if you want.
Once finished, you can share the steps as a JSON file or even export it as a clip. The receiver can then import that file and see the exact steps you performed on your webpage by importing the file into their Google Chrome DevTools Recorder tool.
The only downside is that this Recorder tool is primarily built for developers to test their flows. Unlike a screen recording, it doesn’t visually store everything you do. So, you can only share the specific actions you performed on your webpage.
How to record steps and share them using Google Chrome DevTools
Step 1: Open Google Chrome DevTools
Step 2: Tap on the right arrow and click the Recorder option.
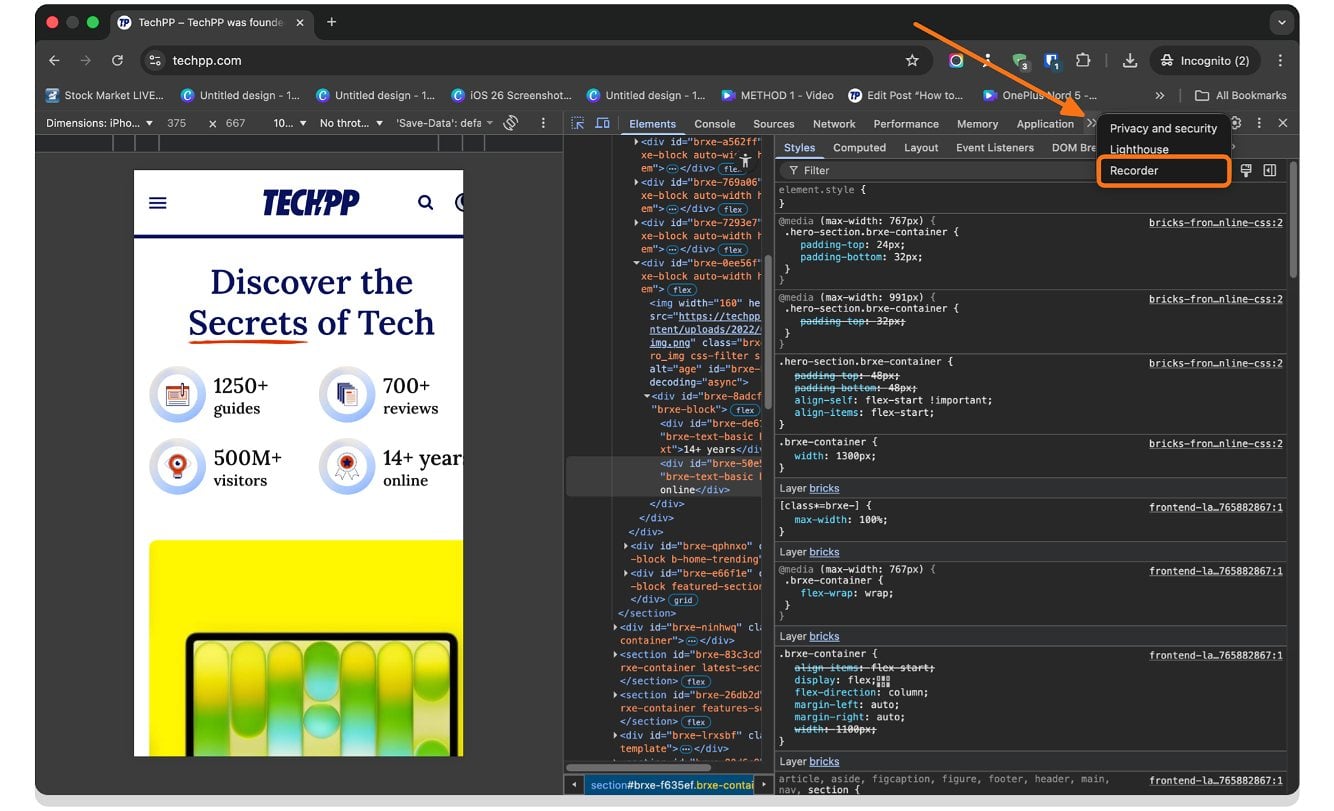
Step 3: Now tap on the Create a new recording button.

Step 4: Give it a name and tap on the Start recording option.

Step 5: Now, you can perform the steps on the webpage; they will be recorded and displayed on the right.

Step 6: Once the recording is complete, tap on the End Recording button.
Step 7: To export a Recorder recording, tap on the “Export” button. On the other hand, a user can tap on “Import recording” to import the steps into the browser.

Load Websites Faster on a Slow or Unstable Connection

Sometimes websites take a long time to load if you have a slow or unstable connection. In these scenarios, you can block websites from loading heavy resources to make websites load faster.
Most modern websites load unwanted resources such as third-party ad scripts, analytics tools, and more. While they won’t slow down the website if you have a good internet connection, if you have slow internet, fetching these resources can take longer than expected.
Using the Google Chrome DevTools, using the network panel, you can block specific unwanted requests from loading.
For example, if a website is loading large ad scripts or heavy third-party files, you can find them and block them. Once blocked, Google Chrome blocks websites from loading those resources, which can improve the loading speed for any website.
However, the only downside is that most of these resources have technical names, which makes it hard for regular users to find the exact unwanted resources slowing down the website and block them. Additionally, if you accidentally block an important resource, it can break the website.
Stop Unwanted Redirects and Pop-ups on Websites
The Google Chrome browser already comes with optional settings that prevent websites from showing any unwanted pop-ups or redirections.
However, despite this setting being turned on, plenty of websites still show unwanted redirections and pop-ups, which can even sometimes download harmful content in the background unknowingly.
Fortunately, you can use the Google Chrome DevTools to temporarily stop websites from redirecting and showing unwanted pop-ups. Similar to how you block heavy resources to increase website speed on slow networks.
You can use the same method to stop websites from loading harmful content.
Once again, the only downside is finding the right harmful resources. If you are a beginner or a non-developer, most of these resources have technical names that can be confusing.
To help you out, here are the most common resources and file formats websites use to show pop-ups and unwanted redirections. If you find these files, immediately block them.
Unwanted Ads and Popups files
| Domain/Pattern | What it does |
| *doubleclick.net* | Google Ad Network often triggers pop-ups |
| *googlesyndication.com* | Google AdSense ads and redirects |
| *popads.net* | Dedicated pop-up ad network |
| *popcash.net* | Pop-under and redirect ad network |
| *propellerads.com* | Aggressive pop-up and push notification ads |
| *adnxs.com* | AppNexus ad network |
| *revcontent.com* | Clickbait redirect network |
| *taboola.com* | Sponsored redirect content |
| *outbrain.com* | Sponsored redirect content |
Redirection files
| Domain/Pattern | What it does |
| *redirect.php* | Generic PHP redirect scripts |
| *go.php* | Common redirect file name |
| *click.php* | Click-tracking redirect |
| *track.php* | Tracking-based redirect |
| *out.php* | Outbound redirect script |
| *link.php* | Link redirect handler |
| *jump.php* | Jump/redirect script |
| Domain/Pattern | What it does |
| *onesignal.com* | Push notification service (often abused) |
| *pushcrew.com* | Push notification pop-ups |
| *subscribers.com* | Subscriber push pop-ups |
| *pushwoosh.com* | Push notification redirects |
Temporarily Edit Text, Images, and Other Page Elements

Using the Google Chrome DevTools, you can temporarily edit any part of the web page directly inside the browser.
For example, if you want to edit the headings, you can easily change its content in the elements, and the changes will be applied to the website.
Not just the text; you can also replace images, change the colors of the website, and more.
Remember that these changes only apply locally in your browser; once you refresh the page, everything returns to normal.
While most users do it for fun, there are instances where it can be very helpful. For instance, as a tech reviewer, I often share how-to tutorials. Every time there is sensitive information on a web page, I try to edit it and add demo content before taking screenshots. This way, instead of sharing sensitive content, I can share the demo content.
Run Useful Scripts Directly from the Console

Google Chrome DevTools also gives you access to the Console, which you can use to directly run scripts inside the Chrome browser without requiring additional tools.
Running scripts directly inside the browser is one of the easiest ways to add additional functionalities.
For instance, a few months back, I shared a dedicated guide on how to run different scripts inside the browser to add additional features where I included are the ability to add and export highlights to any place, expand “Read More” content, lock any browser tab with your password, export all the links on the page as a CSV file, and more.
However, you can also use the DevTools console to temporarily run scripts to automate some most common browser tasks. For example, you can download all images on the webpage at once, export, and import data from any website, and much more.
You can go to the console page, paste this script, and press Enter to run. Here are the best useful scripts you can use.
1. Download all images from the page
2. Highlight likely ad elements in the webpage
3. Show all videos, audio files, and PDFs in webpage
4. Export any HTML table as CSV
5. Make the page editable
6. Force-enable text selection and right click
7. Copy the main article text cleanly
8. Export product names, prices, and links to CSV
9. Find coupon and promo codes on the page
10. Export visible reviews/comments to CSV
See What Data Websites Collect and Store About You
Most websites collect more data about you than you think. Since this data collection happens in the background in most cases, most of us are not aware of what data a website is collecting.
While most websites ask for your consent before collecting data, some websites may collect your information in the background without your permission. This may include your personal details, browsing habits, and device information, which can allow the website to track you.
This data can sometimes be used to show advertising and, in some cases, is even sold to third parties. Fortunately, using Google Chrome DevTools, you can easily know what information the website is collecting about you, and it even allows you to delete the stored information on any website. You can simply head over to Dev Tools and the console tab and tap on the local storage to see what data the website collects and stores.
Here are the most common types of data websites usually collect:

Along with this, you can also go to the Application tab, reload the website, and check what type of requests the website is sending. This way, you can have a complete picture of what data the website collects, stores, and sends to ensure privacy.
Data websites collect | What it usually means | Can you delete it? |
|---|---|---|
Cookies | Includes Login info, preferences, tracking IDs | Yes |
Local Storage | Saved settings, IDs, app data and more | Yes |
Session Storage | Temporary session data, form data abd more | Yes |
Cache | Saved images, scripts, and files and more | Yes |
Device and browser info | Browser type, OS, screen size, language and more | No |
IP address and location | Network details and location and more | No |
Browsing activity | Pages visited, clicks, time spent and more | No |
Form data | Name, email, phone, search queries and more | Yes |
Keep Hover Menus, Tooltips, and Hidden Elements Visible

I am a big fan of Apple’s web development team. Apple has one of the best-looking and cleanest product pages. However, there are a few things that I still find annoying on Apple’s websites. One such thing is a hover effect for the navigation menu.
Don’t get me wrong, it is also one of the best implementations; however, sometimes it can get really annoying, especially if you want to take a screenshot of the element without hovering the cursor.
The problem with hover menus is that they only appear when you hover the mouse over them, and if you move your cursor away, they go back to normal.
Not just Apple websites, many websites show menus, tooltips, and other elements only when you hover the mouse over them. Fortunately, using Google Chrome DevTools, you can force the element state, which solves this problem.
You can force the element state to active. The website then pretends your cursor is over the element and keeps it active even if your mouse is away from it.
The Best Chrome DevTools Features for Regular Users
So those are the eight best Google Chrome DevTools use cases that are actually useful in real life, not just for developers. Taking screenshots, adding device frames, and running scripts directly inside the browser to automate browser tasks are my two personal favorites. Using these tools, you can also record steps and share them with anyone. Additionally, you can block websites from showing ads, tracking your data, and much more. I hope you find this guide helpful.
